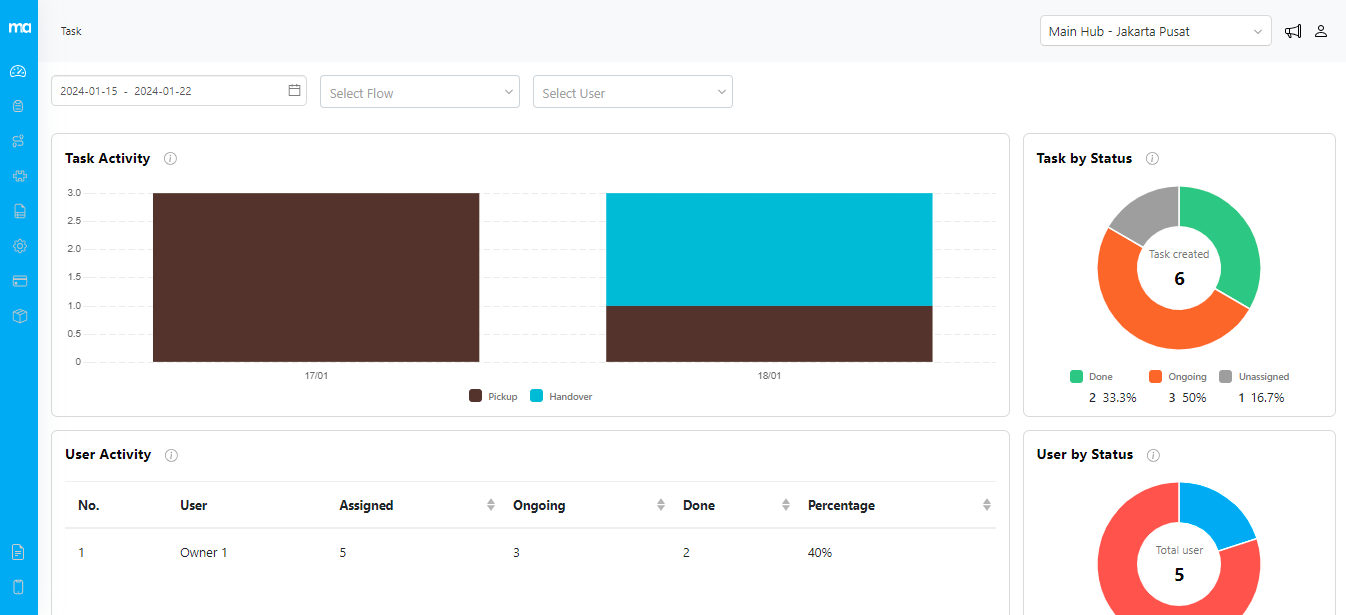
Task Activity
The Task Activity widget displays the count of daily tasks, allowing you to discern patterns and trends in task creation. Tasks are distinguished by their respective flows, providing a clear understanding of workflow distribution over time.Task by Status
The Task by Status widget allows you to compare tasks based on their status. This feature aids in identifying bottlenecks, tracking progress, and ensuring that tasks are moving through the workflow efficiently.User Activity
The User Activity widget concisely summarizes all tasks assigned and completed by individual users. This insightful metric assists in evaluating user performance and workload distribution.User by Status
The User by Status widget allows you to compare task assignments based on user status. “Active” indicates tasks assigned to users, while “Inactive” represents tasks without assigned users.Data Filtering Options
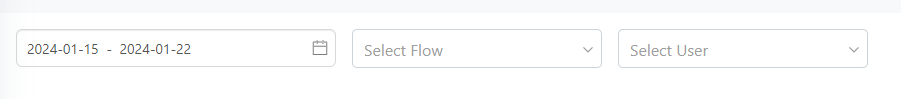
The Dashboard menu offers versatile data filtering options to enhance your analytical capabilities.