Accessing the Automation Log
- Navigate to the Flow/Automation page.
- Click on the icon labeled “Log”.
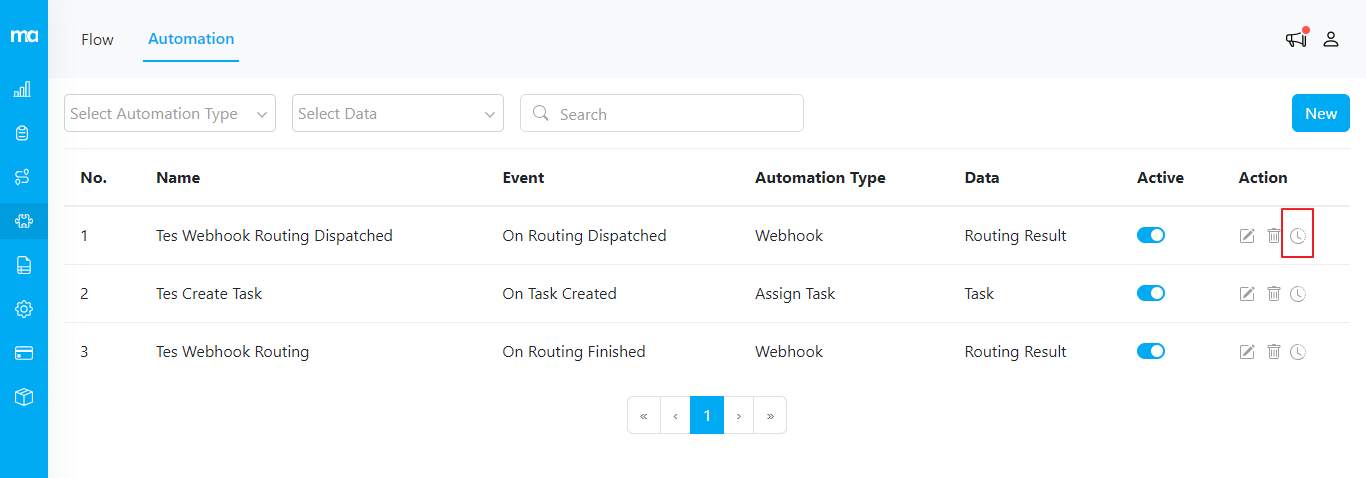
Automation Log Icon
Understanding the Automation Log Details
The Automation Log provides detailed information about each automation event. Here are the key elements: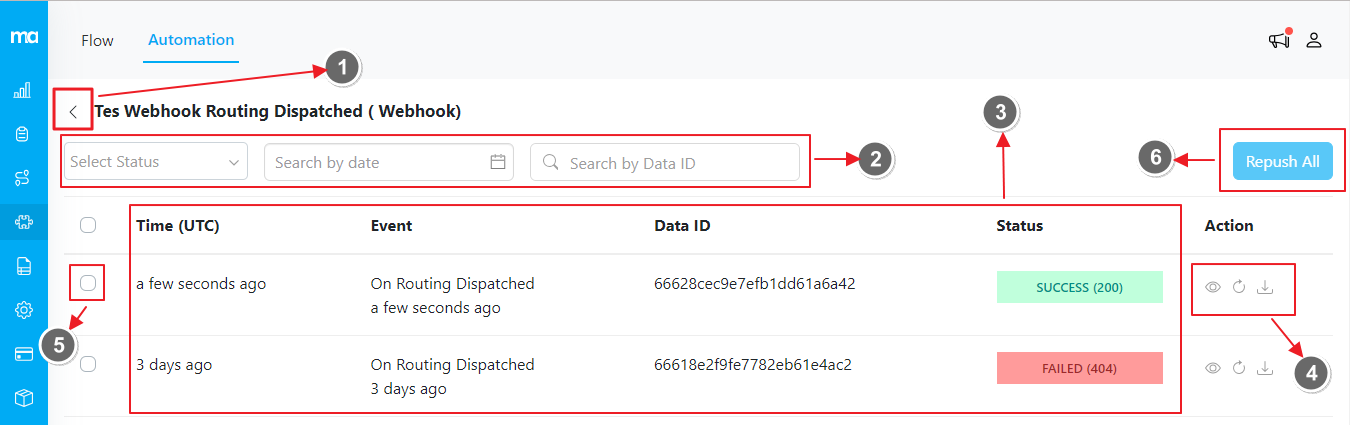
Automation Log Page
- Back to the Automation page
- Filtering the Log:
- Select Status. You can filter the logs by their status - either “Success” or “Failed”
- Search by date. Filter the logs by a specific date. Note that only one date can be selected at a time
- Search by Data ID. You can filter the logs by Data ID. For example:
66628cec9e7efb1dd61a6a42
- Log Details:
- Timestamp of Automation Activation: This timestamp indicates when the automation type action was successfully executed. For instance, if the automation type is “Assign Task”, this timestamp marks when the task was assigned to a field user according to your settings.
- Timestamp of Automation Trigger: This timestamp indicates when the automation event was triggered, initiating the automation type action. For example, if the automation event is “Create Task”, this timestamp marks when the task creation triggered the subsequent automation action.
- Data ID. This ID identifies the source payload, such as Task ID or Routing Result ID, depending on the data you selected when setting up the automation.
- Status. This shows the status of the automation log, either “Success” or “Failed”. If the status is “Failed”, the status code (e.g., 404) will also be displayed.
- Available Actions:
- View Payload Details: Click to see the detailed payload information.
- Retry Log: You have the option to retry an individual log entry. When you click on the retry icon, the detailed JSON of the log will be displayed. This allows you to review the log details before submitting.
- Download Log: Download the automation log as a .json file.
- Select Automation Log: You can select specific logs to take action on.
- Repush All: After selecting specific logs, click this button to repush them all simultaneously.