- Vehicles
- Time
- Capacity
- Others
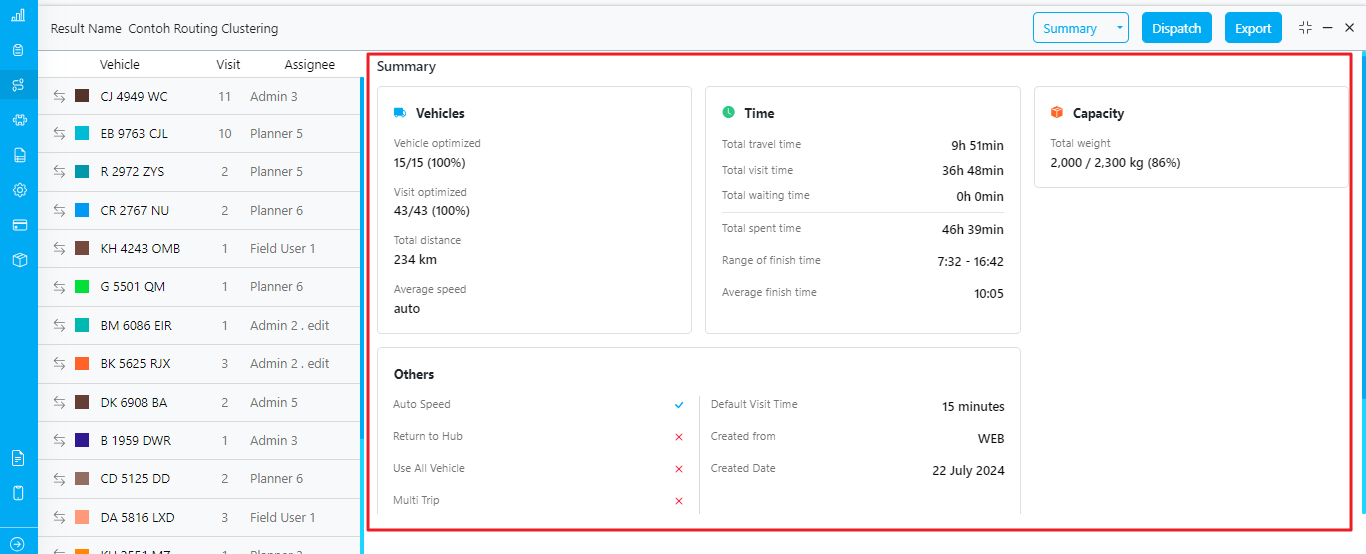
Vehicle
- Vehicle Optimized: Displays the percentage of assigned vehicles versus unused vehicles. For example,
15/15 (100%)means that all 15 vehicles have been assigned visits, resulting in 100% utilization. - Visit Optimized: Displays the percentage of routed visits versus unrouted visits. For example,
43/43 (100%)means that all 43 visits have been routed into the vehicles, resulting in 100% optimization. - Total Distance: Displays the total distance covered by all assigned vehicles in kilometers. For example,
234 km. - Average Speed: Displays the average speed of all assigned vehicles. If “Auto Speed” is selected in the configuration, it will show “auto”.
Time
- Total Travel Time: Displays the total duration of all assigned vehicles. For example,
9h 51minmeans the total travel time for all vehicles is 9 hours and 51 minutes. - Total Visit Time: Displays the total duration of all assigned vehicles when they arrive at visit locations, such as during handovers or unloading. For example,
36h 48minmeans the total visit time for all vehicles is 36 hours and 48 minutes. - Total Waiting Time: Displays the total duration of all assigned vehicles before they can process tasks, such as when waiting for a store to open. The waiting time is related to the “Open Time” data per visit.
- Total Spent Time: The sum of total travel time, total visit time, and total waiting time.
- Range of Finish Time: The earliest to the latest finish time of all assigned vehicles. For example,
7:32 - 16:42means the earliest finish time is 7:32 and the latest finish time is 16:42. - Average Finish Time: The average finish time of all assigned vehicles. For example,
10:05means the average finish time is 10:05.
Capacity
The capacity field is dynamic based on the configuration used. For example,Total Weight 2,000 / 2,300 kg (86%) means a total of 2,000 kg is optimized out of a maximum total of 2,300 kg across all vehicles, resulting in 86% optimization.
Others
This section shows the configuration settings used. For example, if the “Return to Hub” option is activated, there will be a checklist icon; otherwise, it will show an X icon. Additionally, it displays the source of the routing optimization and the creation details, such as:- Created from: WEB
- Created Date: 22 July 2024